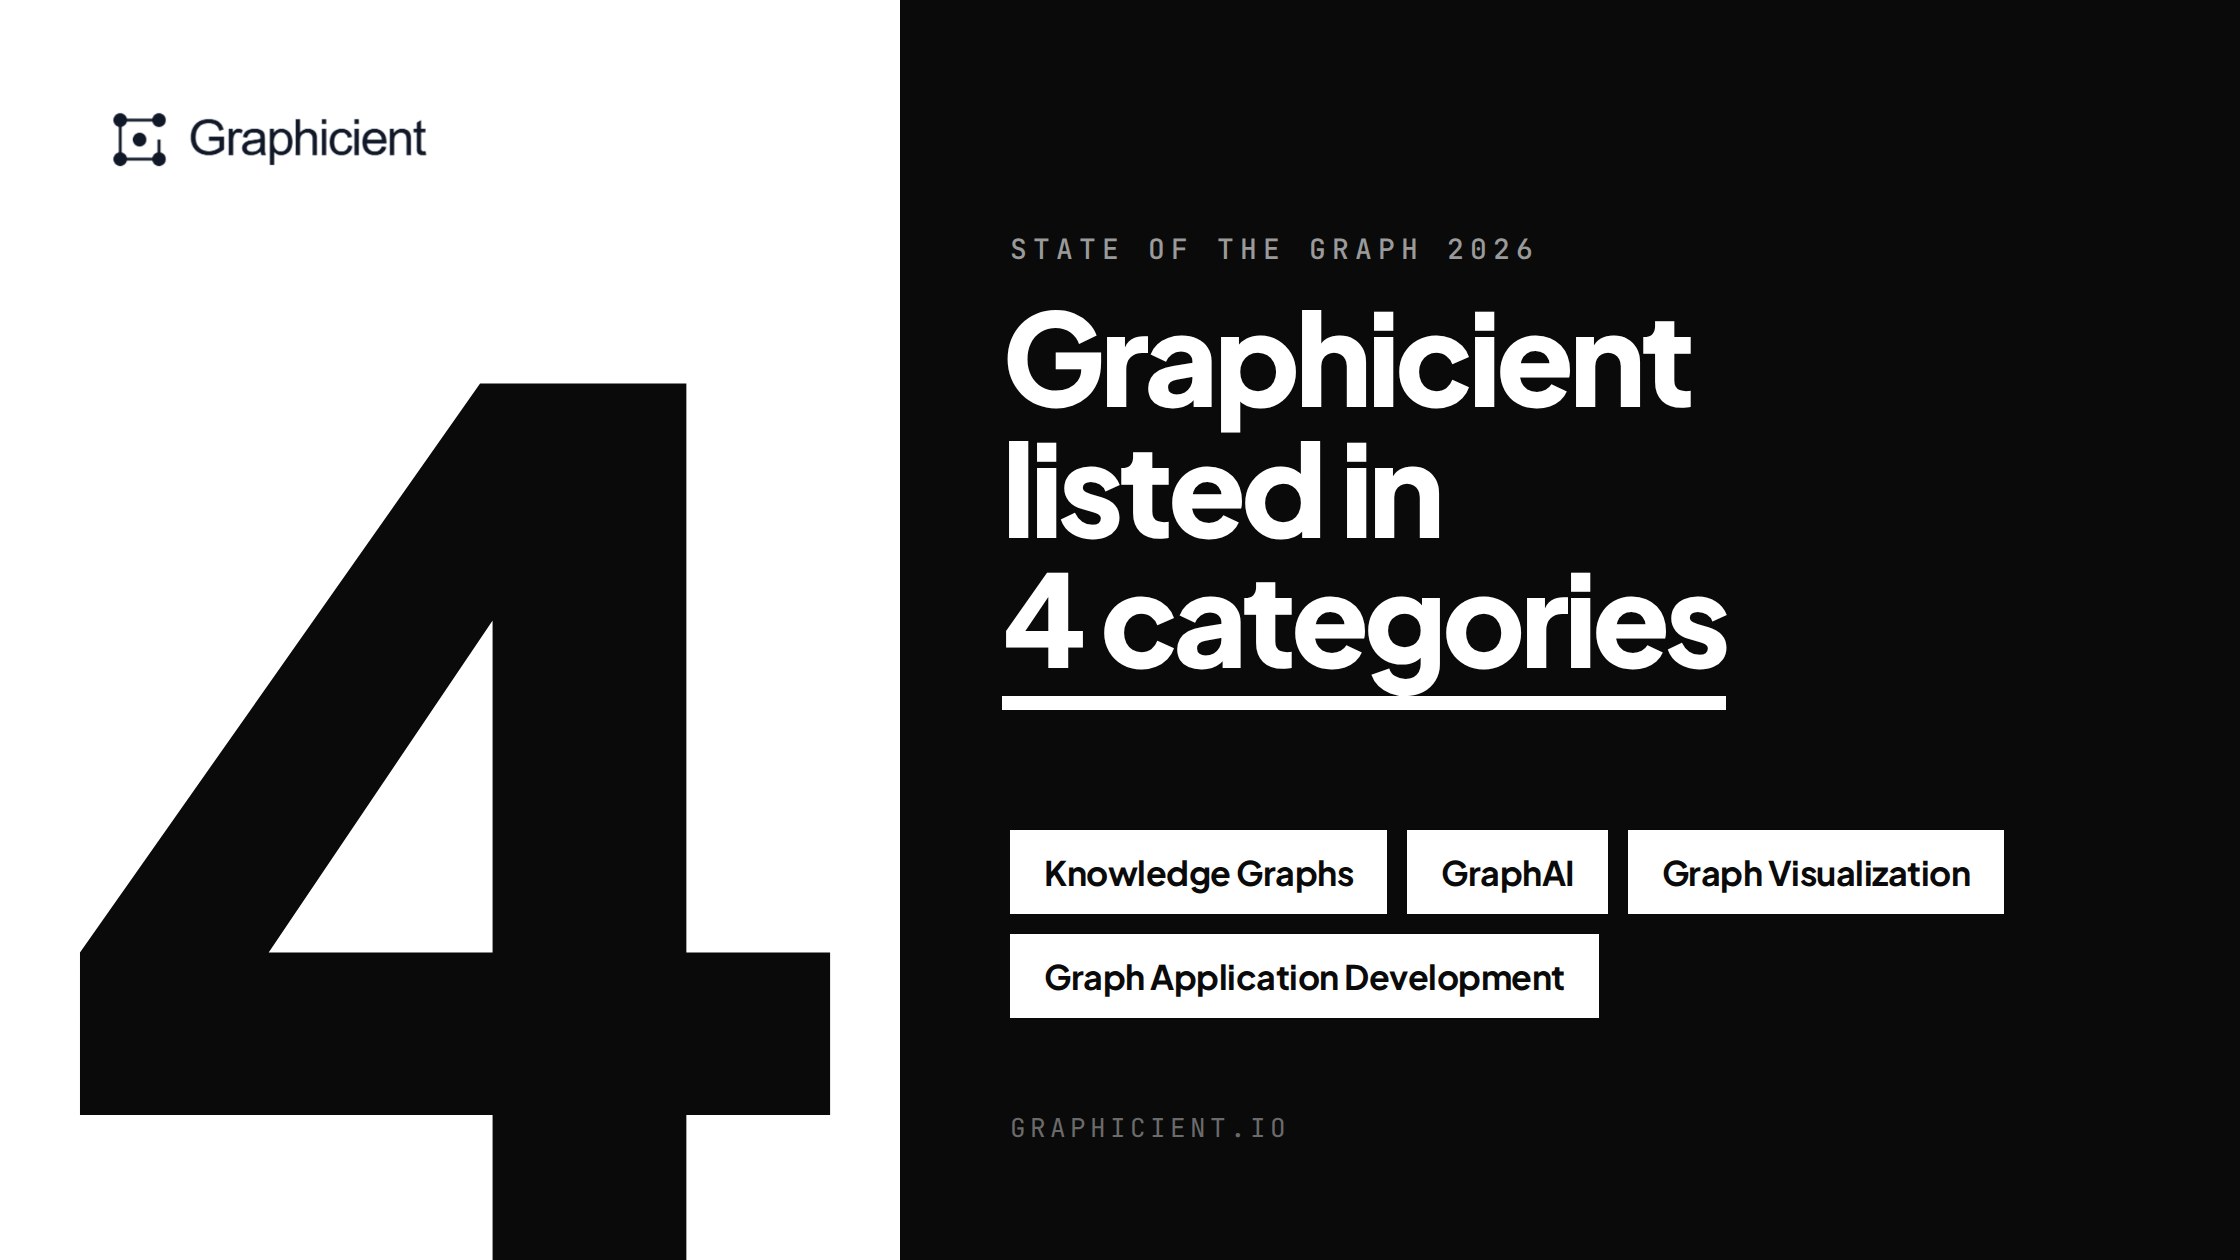
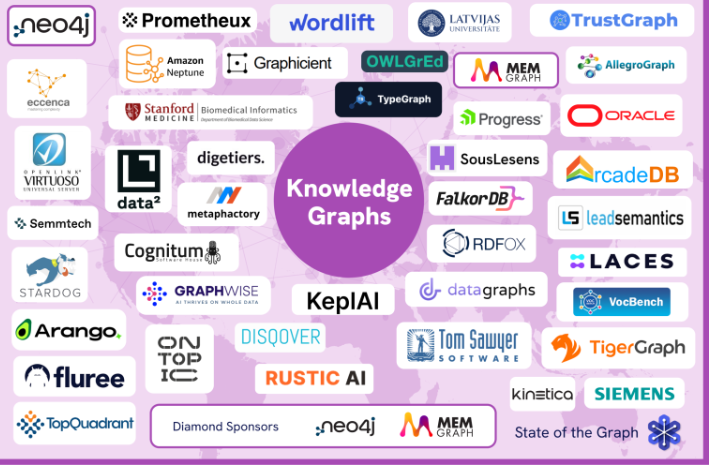
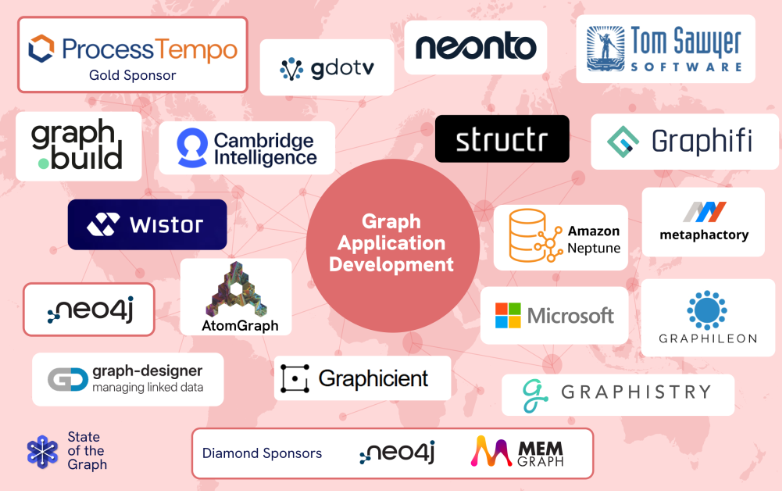
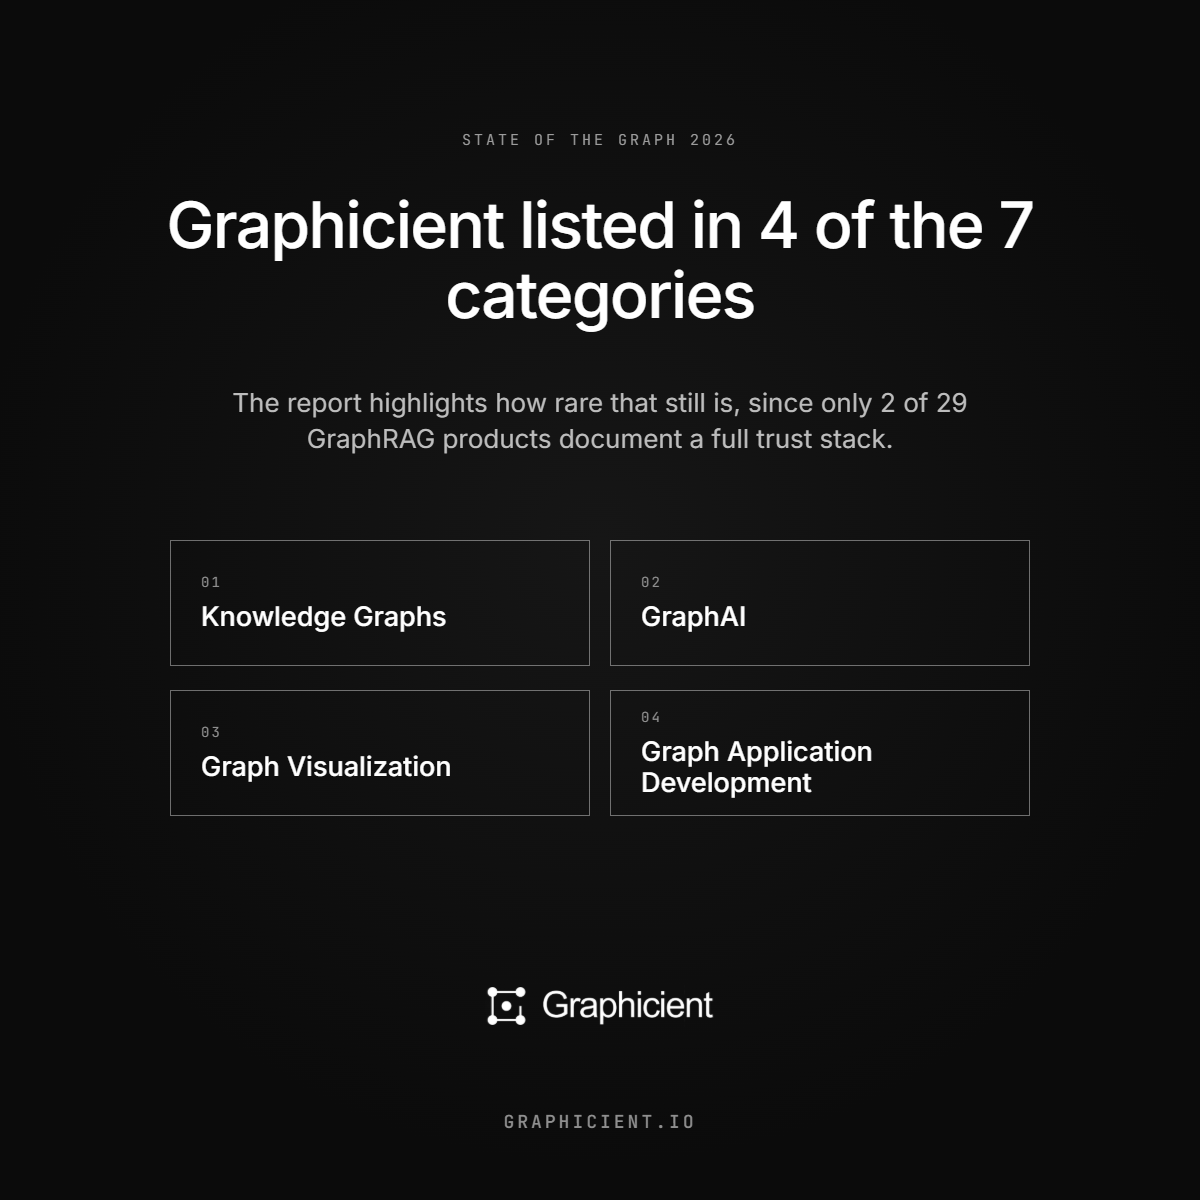
Graphicient is listed in four of the seven categories of the new State of the Graph 2026 map: Knowledge Graphs, GraphAI, Graph Visualization and Graph Application Development.
The map sorts graph technology into seven broad families, from graph databases all the way to AI. It shows how far the graph ecosystem now reaches, and we are proud to appear alongside our partner Neo4j, the only vendor present in all seven categories.
Of the 146 vendors mapped, 109 appear in a single category. Being listed in four of them reflects a conviction we hold: the value of a knowledge graph is delivered end to end, from the way data is modelled to the answer a user receives.
Four categories, one platform
These four categories mirror the way our platform is built. Each one matches a step in the journey of the data, and all of them rely on the same graph.
 01 · STATE OF THE GRAPH
Knowledge Graphs ↗
“Models that organize information into a network of entities and their semantic relationships for deeper context and meaning.”
The knowledge graph connects data in a single, reliable model.
Structure →
 02 · STATE OF THE GRAPH
Graph Application Development ↗
“Environments such as IDEs, no-code, and low-code simplify the building, deployment, and management of graph-powered applications.”
Business experts design that model themselves, without writing any code.
The ontology →
 03 · STATE OF THE GRAPH
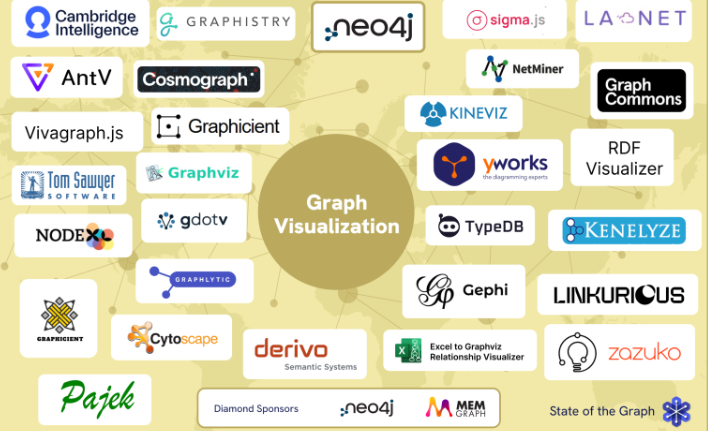
Graph Visualization ↗
“Tools that render graph data visually, helping users explore connections and navigate complexity.”
Teams explore the graph visually across complex data and knowledge ecosystems.
Explore →
 04 · STATE OF THE GRAPH
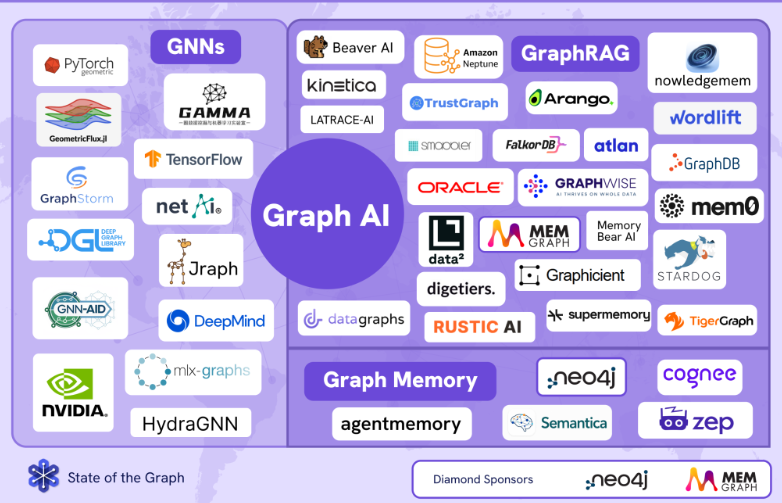
Graph AI ↗
“Systems in which graph structure plays an active role in AI, not just as infrastructure behind the AI but as a core mechanism shaping what is retrieved, remembered, or learned.”
Teams query the graph in natural language and get answers that are explained and sourced.
Query →
Maps and definitions: Categories page, State of the Graph 2026.
A model designed by the people who know the business
The knowledge graph connects data in a single, reliable model. Business experts design that model themselves, without writing code, because they are the ones who know their activity best.
Putting modelling in the hands of the business is what places Graphicient in both the Knowledge Graphs and Graph Application Development categories: the graph is built in a no-code environment, by the people who actually use it.
Explore visually, query in natural language
Once the model is in place, teams explore the graph visually to navigate complex data and knowledge ecosystems. They also query it in natural language, and every answer is explained by the path it followed through the graph, then linked to a verifiable source.
The report shows how rare this still is. For Graphicient, it is a starting requirement: an answer whose reasoning can be traced back to its source is an answer you can rely on to make a decision. It is also the purpose of our work on trustworthy AI.
A growing ecosystem
The State of the Graph 2026 map confirms that graphs are no longer a niche technology: they now shape data, visualization, application development and AI. We are delighted to appear alongside Neo4j, and to show that a single platform can cover the whole journey, from the business model to the sourced answer.
One graph, four uses, and an answer you can verify.