Forged parts, moving tariffs: answering the question no one has asked yet
A major aircraft manufacturer asked us a simple question: "What is our exposure on our forged parts?"
Behind that question sits the whole problem Graphicient was built to solve. Here, step by step, is what we showed, and why a handful of natural-language questions did what weeks of manual analysis could not settle.
A question that always comes from next door
A critical forged part never lives alone. It depends on a chain no one sees in full: the material and its country of melt, the forger and its qualified alternatives, the aircraft programs that consume it, its customs classification, and the documents that trace all of this. The information exists, but it is scattered across several systems, each built for its own purpose.
The trigger, here, is regulatory. US Section 232 is a duty on the metal content (aluminium, steel) at import into the United States. It is not a fixed law: it is an instrument the executive adjusts regularly, the rate, the scope and the exemptions change by decision, sometimes from one month to the next. So the question "what is our exposure?" does not have one answer, it has a new one every time the rule moves.
This is where a structural problem surfaces. Business teams produce views, dashboards, analyses. Each one answers a precise question, from a precise angle, the one that presided over its construction. That stability is useful, but it is a prison: the point of view is cast into the schema. When a neighbouring function, a buyer, supply chain, a program, quality, arrives with a question framed from its own angle, triggered by an outside event such as a customs move, the structure goes silent. Two outcomes, both bad: either you answer "the data does not exist from that angle" (which is false, it exists, it is simply filed differently), or you launch a new development of several weeks, which freezes one more point of view, walled in its turn. BI does not scale in number of angles, it scales in number of projects.
Add to this a reality everyone knows: out of the total number of forged parts, only some are traced end to end. The objection writes itself: "our data is incomplete, we cannot start." We are going to show that the opposite is true.
Not one more dashboard
A business ontology, a knowledge graph, and questions asked in natural language. One story, five questions that chain together, each operating on the result of the previous one, narrowing 530 parts down to 15 that are burning. At each step the graph does not just give a number: it shows why, by making the path to the answer visible and verifiable.
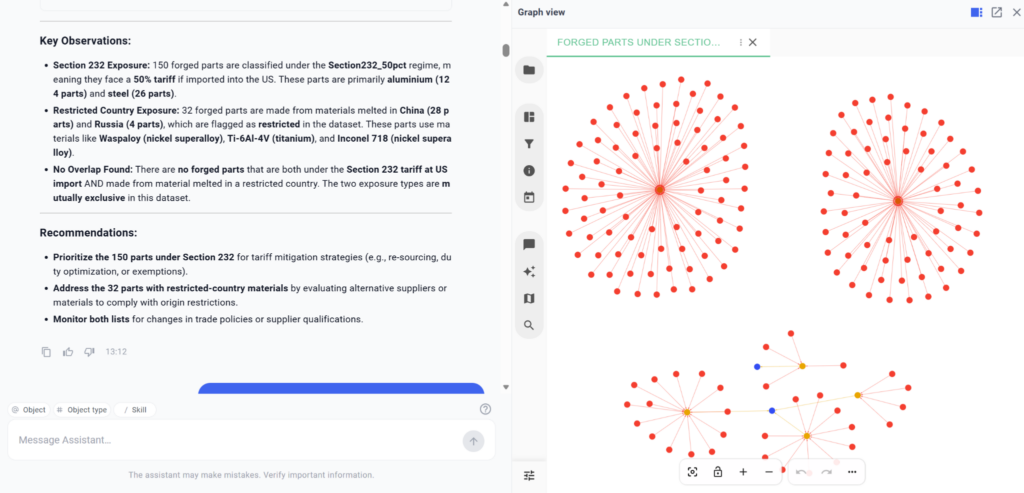
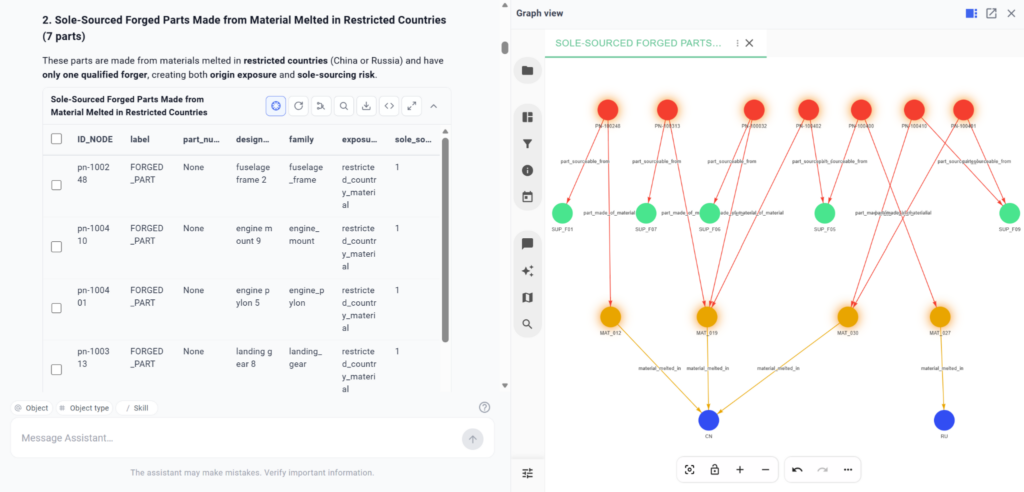
One point of vocabulary, because it sits at the heart of the demonstration. Exposure has two vectors, and they are mutually exclusive. Aluminium and steel fall under the tariff risk (Section 232 on metal content). Titanium falls under an origin risk (a restriction on the country of melt), outside the customs scope. A part is concerned by one or the other, never both at once. A flat table loses that nuance; the graph carries it.
Creating meaning by linking our business concepts
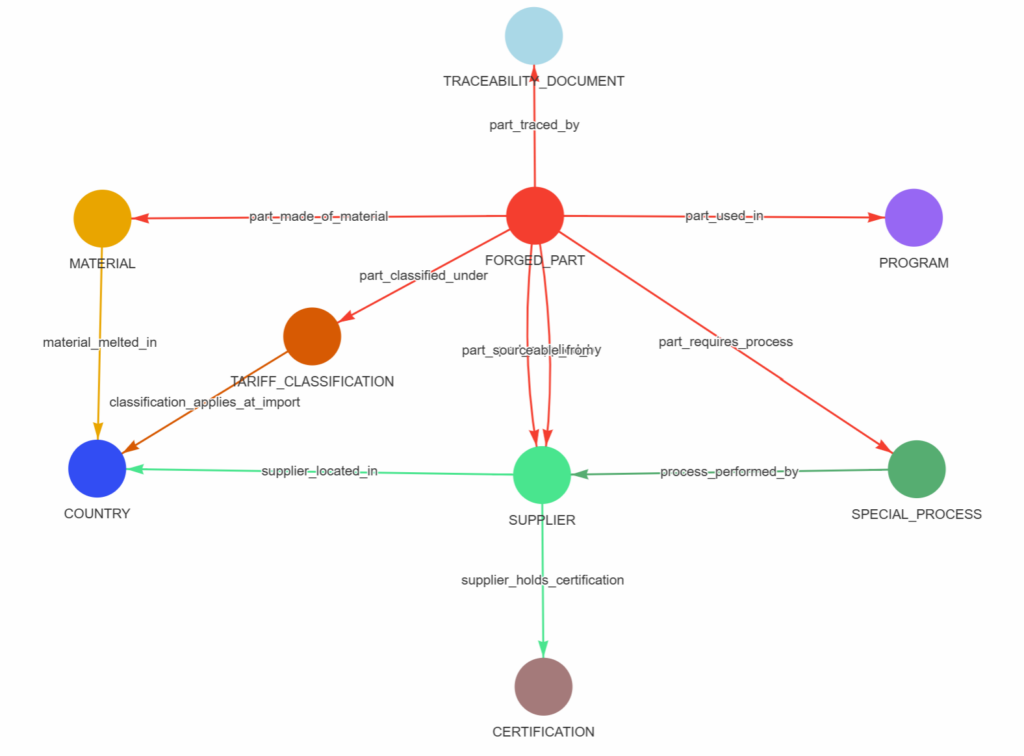
- 🔴 FORGED_PART: a high-integrity metal component (e.g., landing-gear fitting, wing-root fitting). Each has a part number, criticality (flight_safety/structural/non_structural), and family (landing_gear, engine_mount, etc.).
- 🟢 SUPPLIER: a company that makes or processes parts. Key attributes: type (forger, machinist, heat_treatment), financial_health (fragile/watch/solid), and country.
- 🟡 MATERIAL: the alloy (e.g., Ti-6Al-4V titanium, Inconel 718) plus country of melt, because tariffs and restrictions depend on where the metal was melted, not where the part was forged.
- 🟣 PROGRAM: an aircraft model with its Final Assembly Line (FAL). The FAL location determines if parts cross customs borders.
- 🔵 TRACEABILITY_DOCUMENT: proof of origin/process (e.g., material certificate, NDT report). The present flag (true/false) turns missing documents into queryable risks.
- 🟠 TARIFF_CLASSIFICATION: the duty regime (e.g., Section232_50pct for 50% US tariffs on aluminium/steel) and where it applies (e.g., at import into the US).
A 🔴 forged part is: supplied by a 🟢 supplier (current primary maker); sourceable from a 🟢 supplier (qualified backup makers, count these to find sole-source parts); made of a 🟡 material (links to alloy plus country of melt); used in a 🟣 program (links to aircraft models); traced by a 🔵 traceability document (or explicitly missing); classified under a 🟠 tariff classification (duty exposure).
A 🟢 supplier is located in a 🔵 country (operating location) and holds a 🟤 certification (NADCAP, EN9100, expiry dates matter). A 🟡 material is melted in a 🔵 country (origin for tariffs and restrictions).
Frame the battlefield
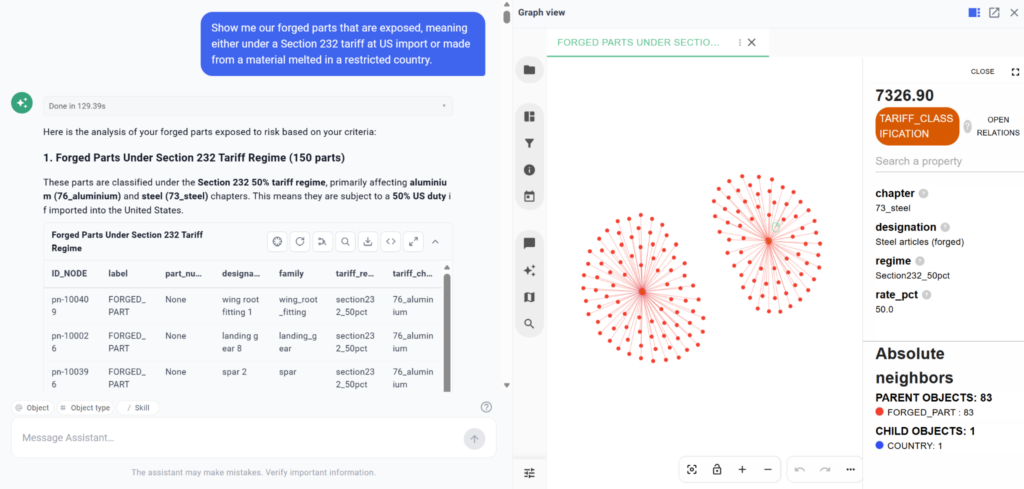
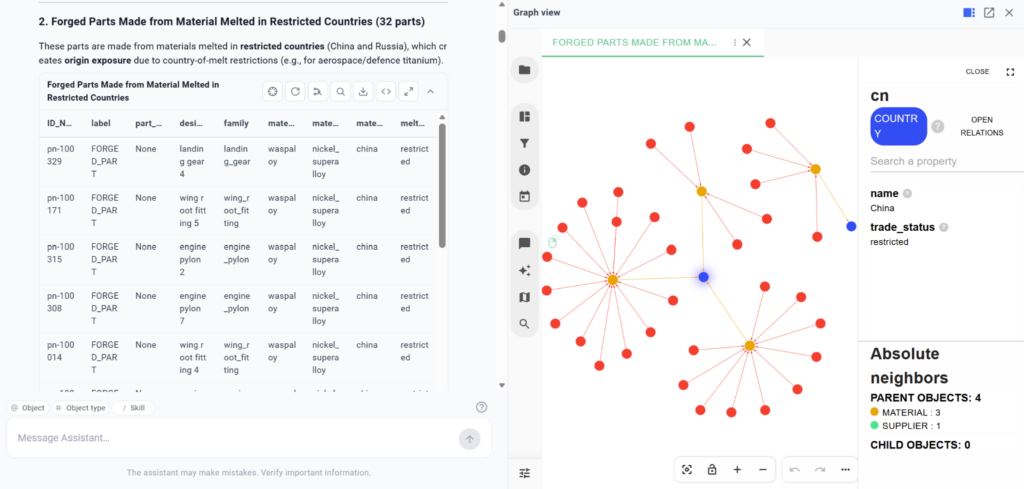
"Show me the forged parts that are exposed, either under Section 232, or made from a material melted in a restricted country."
The key word is "or." If you look for parts that are both taxed and of restricted origin, you get zero, because the two vectors exclude each other. The graph, guided by the ontology, understands this is a union, not an intersection. That alone is something a flat table does not do: seeing the part, the material and the country as a single connected path.
Find the real vulnerability
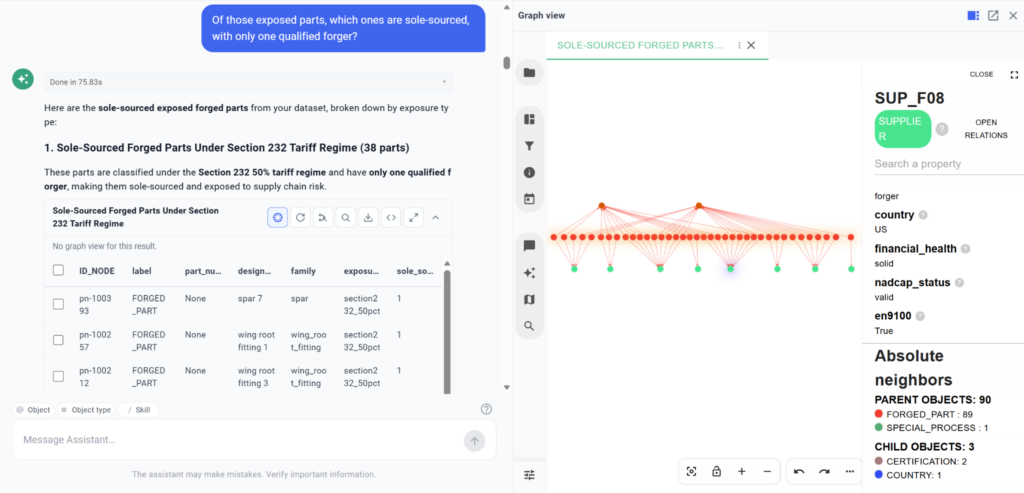
"Of these exposed parts, which are sole-sourced, with a single qualified forger?"
On the graph, the contrast is immediate. A sole-sourced part has a single forger node attached. A neighbouring part has two or three. Sole source is not a column in a table, it is an absence in the graph: if there is only one supplier, there is no plan B, and the part cannot be re-sourced quickly if that supplier falls.
The data gap becomes a filter
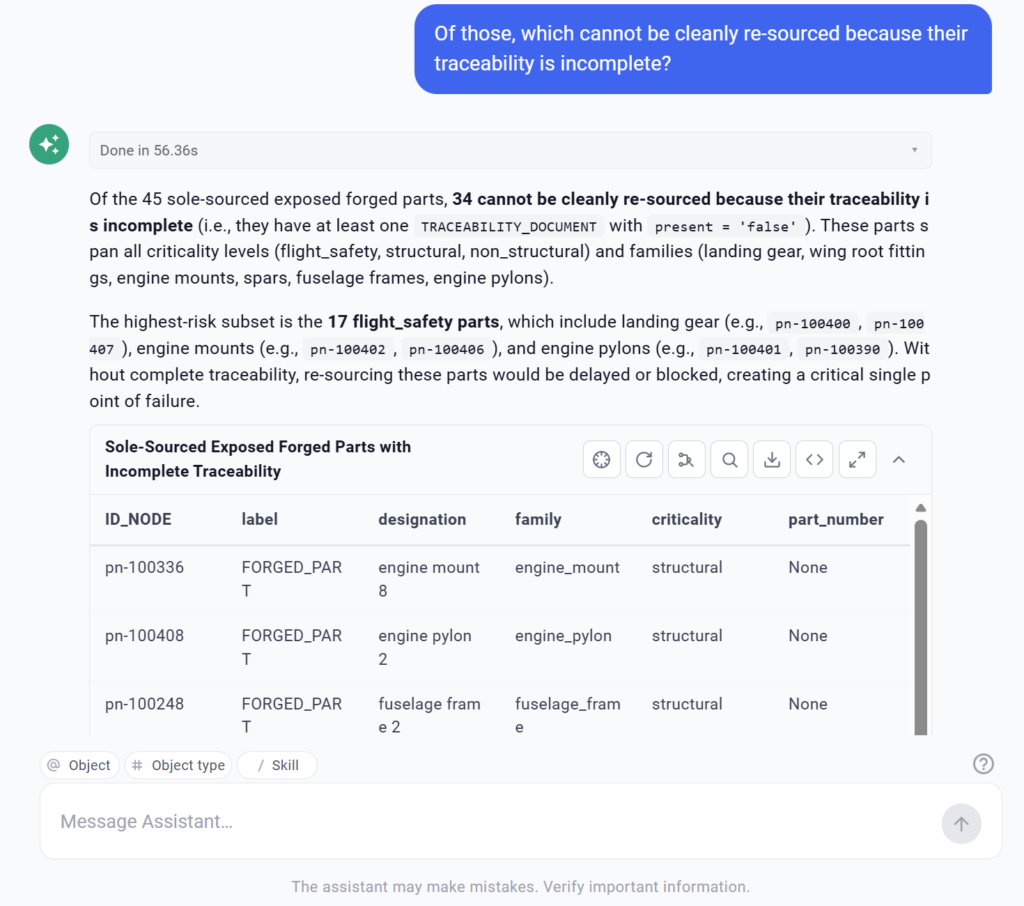
"Of these, which cannot be cleanly re-sourced because their traceability is incomplete?"
Here we show the grey node, the missing document. The gap is not a footnote, it is an object in the graph. Without the material certificate, re-sourcing is impossible: you do not know the chain. This is the moment the objection "our data is incomplete" turns around. These traced parts are not a limit, they are a starting point: the graph models the absence and therefore knows exactly where it is.
The climax
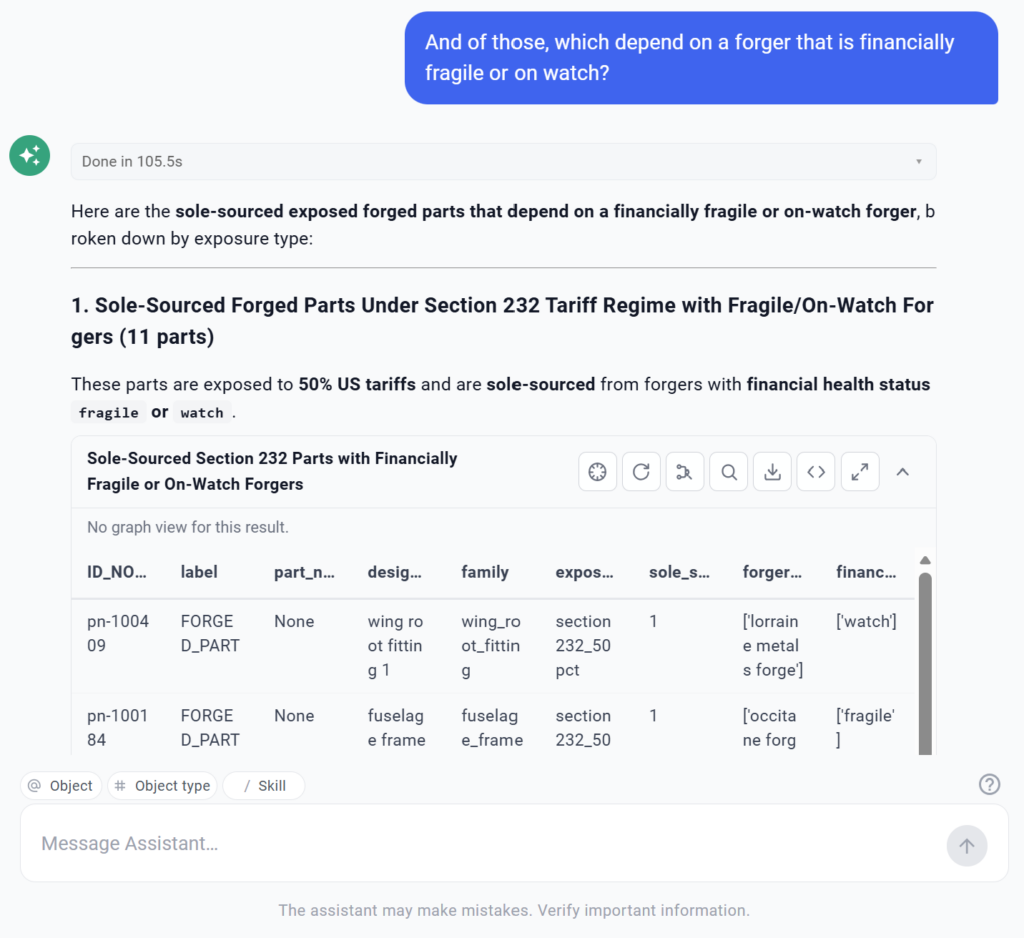
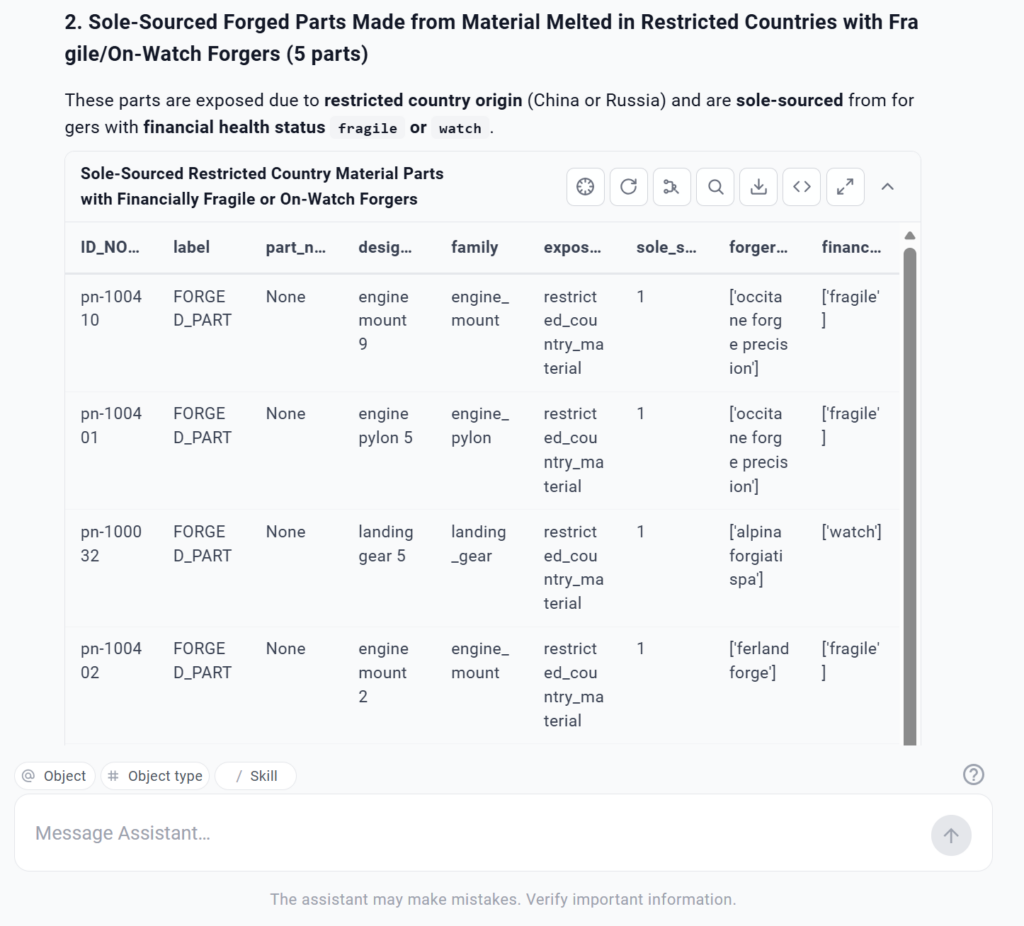
"Of these, which depend on a forger that is financially fragile or on watch?"
The graph zooms into a dense subset: the parts, their fragile forgers, their restricted-origin materials, their missing documents, all interconnected. This is no longer a list of rows to sort through in a panic. These are the parts, including the flight-safety ones, and for each we can say precisely why it is there.
From analysis to action
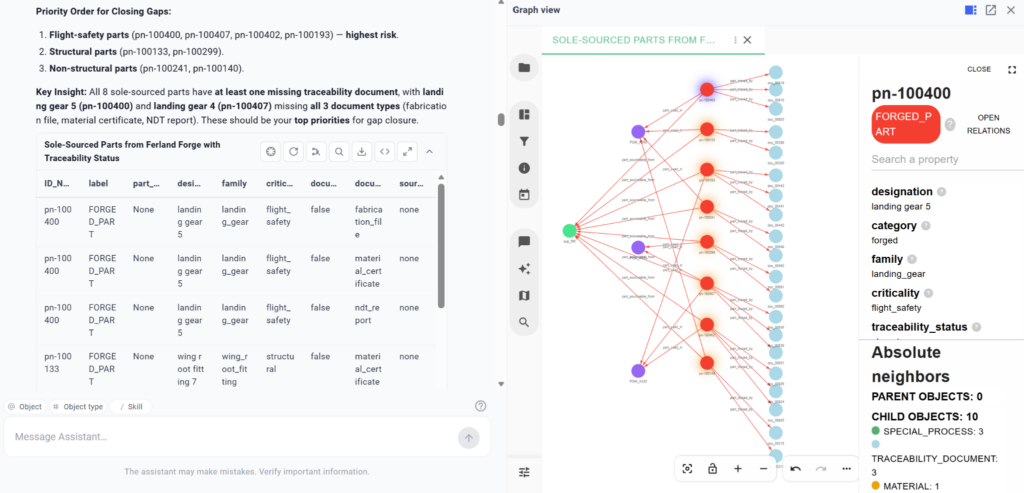
If a given forger falls, which parts and which programs fall with it, and for the parts we must re-source, which traceability gaps should we close first?
The graph lights up the propagation in a cascade: from the forger node to the parts, then to the aircraft programs. The blast radius is visible at once. And the second half of the answer is the real deliverable: the graph ranks the gaps by risk and says which to close first, and why. The data gap stops being an obstacle, it becomes a prioritized roadmap.
One-click to flag suppliers at risk
Beyond the five questions, we froze this reasoning into an agent skill, a supplier-risk sentinel.
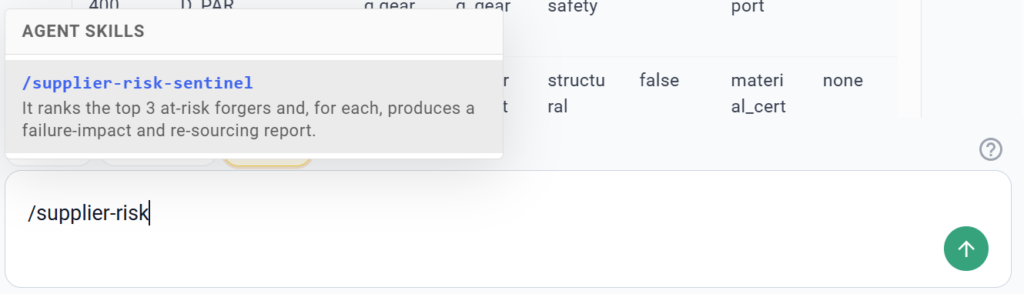
Rather than replaying the demonstration by hand, the agent walks the graph on demand and surfaces the suppliers most at risk, each with the impact of a failure, the sole-sourced parts no other forger can produce, and the traceability gaps to close first. Risk here is not an intuition: it is computed, as the product of a likelihood (the supplier's health, the state of its certifications) and an impact (the number of critical parts for which it is the only source). A large supplier is not necessarily a supplier at risk, and the agent proves it, graph in hand.
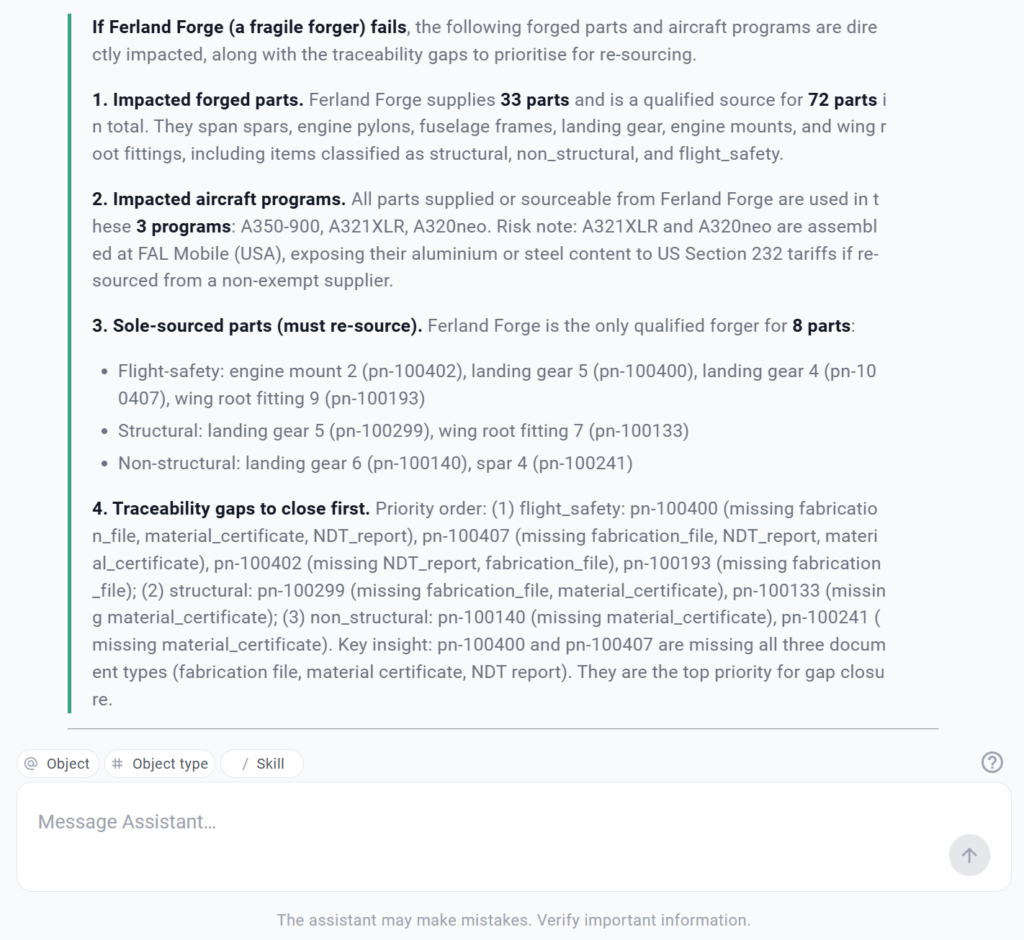
Two principles make it trustworthy. First, it reads the data from the graph, it does not invent it: every count is the result of a verifiable traversal of the graph, and a validated question freezes into a reproducible query that returns the same result on every run. Second, the business keeps control: if the agent gets a value wrong, you correct it in plain language and it realigns. This is where the use case stops being a demonstration and becomes an asset: the reasoning no longer lives in an analyst's head or in an ageing file, it is capitalized, reusable, and it grows with every new tricky question.
What you actually keep
First, the angle is free
The graph does not file points of view, it files facts and their links. The angle lives in the question, not in the data. Any actor, at the interfaces of the business, asks from their own angle, with nothing pre-built. You move from a BI that answers N planned questions to a graph that answers the questions you have not asked yet.
Second, the model evolves with the business
When a question reveals a missing concept or relationship, you add it to the ontology without breaking what exists. The business is no longer walled inside the schema cast at the start, it evolves its own representation as questions come in. The ontology remains its property, exportable at any time.
Third, value compounds
The customs rule moves again next month? You ask again, the answer is current in minutes. This is not a one-off audit that expires at the next decree, it is a permanent capability. Every gap closed, every question asked, every source connected enriches the same graph. A consultant's report ages in a drawer; a graph gains value with every use.
We do not replace BI, nor the customer's system of record. BI does very well what it is built for, answering one question from one stable angle. Graphicient addresses the class of questions it cannot, by design, serve: the cross-functional, unforeseen questions that come from next door. We are a layer on top, not a replacement.
Only one angle among many
This use case is only one angle (supplier risk). The same data, connected in a graph, answers tariff exposure just as well as supplier concentration, obsolescence management or compliance. That is the whole point of filing facts rather than points of view: tomorrow's questions already find their answer in today's graph.
We ran this complex industrial use case in production, at a leading carmaker, before replaying it in aerospace. Each time, the same conviction and vision.
We are not asking you to believe us. We are asking you to verify.
Want to see what this would look like on your own parts, your own questions?
We're not asking you to trust us, we're asking you to verify
Let's see what it looks like on your parts and your questions.
Subscribe to our newsletter
Insight on knowledge graphs, straight to your inbox.